Working with Grid Measurements
From QuickBuild v5, grid measurements are collected every 5 minutes from all action nodes. All measurement are separated into below group:
- Virtual Machine
- CPU
- Disk
- Physical Memory
- Build Request
- Builds
- Steps
- Web UI
- REST
- Download
- Upload
- RPC
- Network
- Database Connection
- Jetty Connection
- SWAP
- Resources
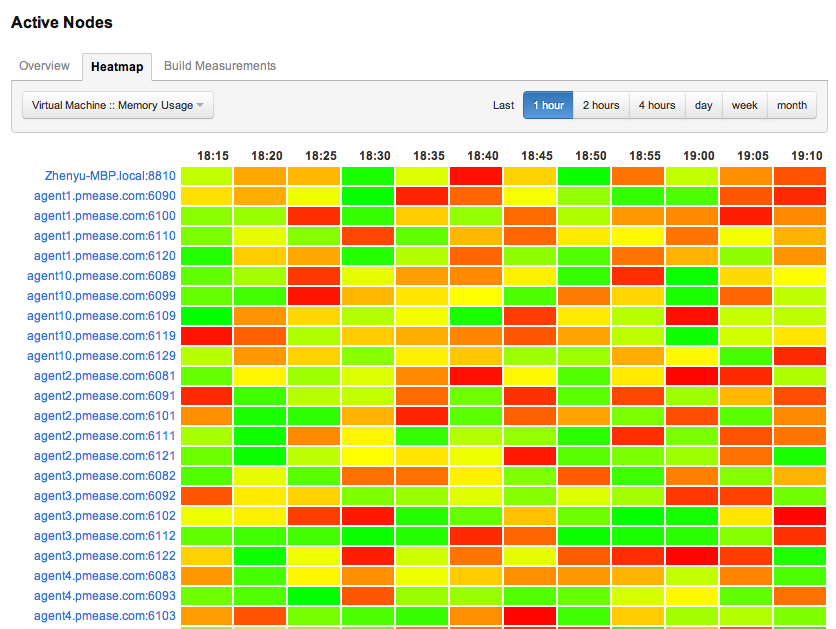
Heatmap for Active Nodes
Heatmap is basically a table that has colors in place of numbers. Colors correspond to the level of the measurement. It's useful for finding highs and lows and sometimes, patterns. From the heatmap view for those active nodes, you may easily know which node/nodes is/are in problem.
So far, two metrics can be chosen to display the heatmap, one for JVM memory usage, and the other is CPU total usage.
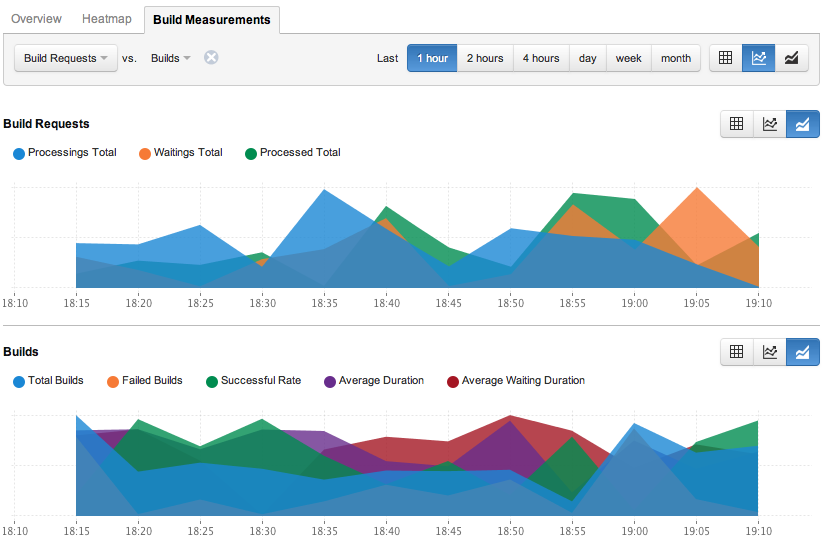
Build Measurements
Build measurements for the system including:
- Build Requests: processings total, waitings total and processed total
- Builds: total builds, failed builds, successful rate, build average duration and average waiting duration
- Steps: runnings total and waitings total
Node Measurements
For each node, below measurements are collected:
- Virtual Machine: memory usage
- CPU: total usage
- Build Requests: processings on node and waitings on node
- Steps: runnings on node
- Disk: disk usage
By default, QuickBuild will only monitor the disk where the storage directory defined. But you can specify any disks you want to monitor from the measurement plugin setting. Please go to this page for more details.
Server Measurements
Beside the measurements for all node above, the server measurements also including:
- Virtual Machine: Heap usage, GC runs, GC time and thread counts
- Network: rxBytes and txBytes
- SWAP: total usage
- Database: total connections and busy connections
- Jetty server: total connections in thread pool and used connections
- Web UI visits
- REST visists
- RPC visits
- Download visits
- Upload visits
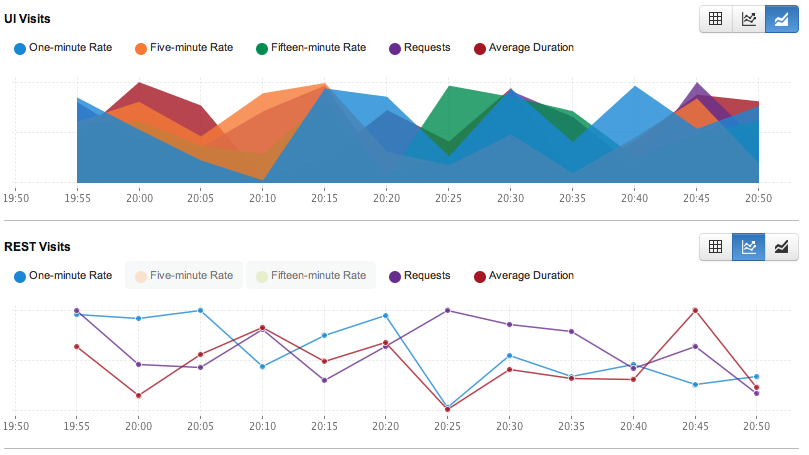
For Web UI visits, REST visits, RPC visits, Download visits and Upload visits, QuickBuild will collect below metrics:
- One-minute rate
- Five-minute rate
- Fifteen-minute rate
- Requests number
- Average duration for each request
One-minute rate, Five-minute rate and Fifteen-minute rate are requests rate in requests per minute. If you want to know more about what they are, you may refer to below page for more details:
https://en.wikipedia.org/wiki/Moving_average#Exponential_moving_average
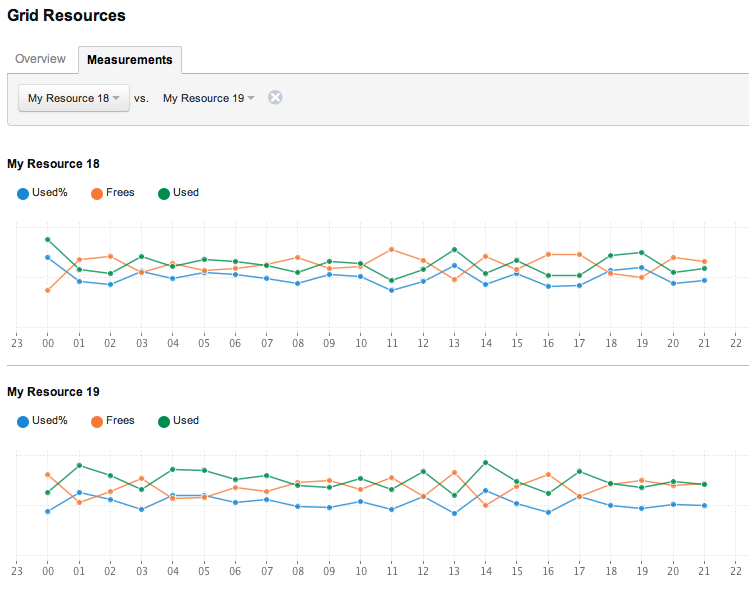
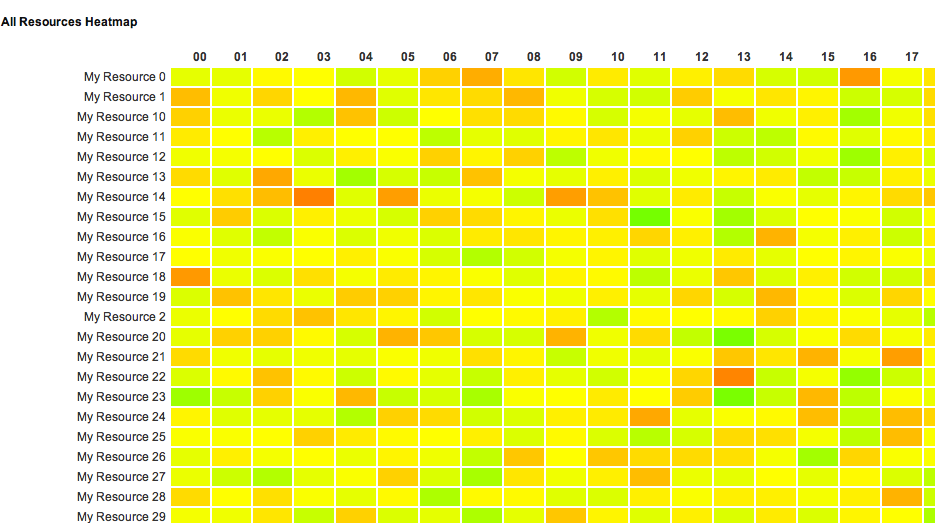
Resource Measurements
Resource measurements including:
- Used percentage
- Used by name
- Frees by name
You may show the heatmap for all resources:
or you can view one resource's measurements, or compare to another resource: