Working with Statistics
All statistics data of a configuration can be viewed in Statistics Tab.
++Screenshot: Statistics Tab++
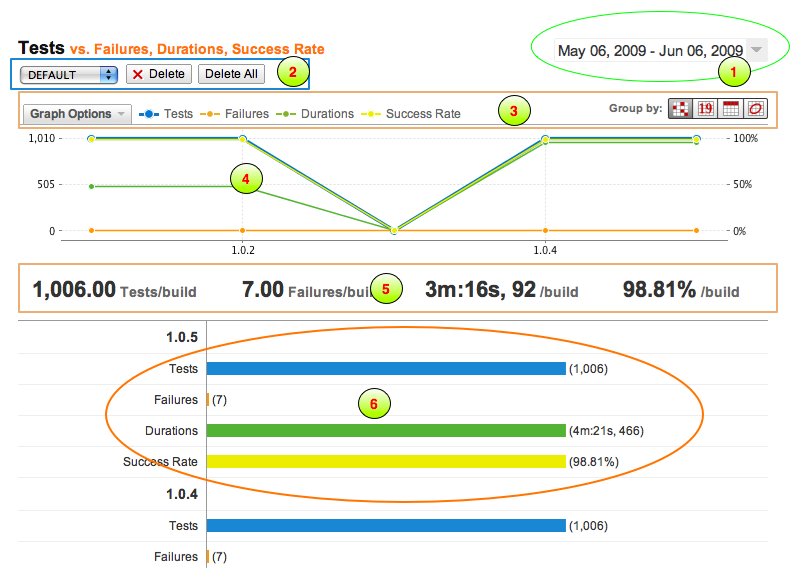
The statistics page includes:
- Date Range Viewer/Selector
- Report sets toolbar (If multiple report sets have been defined)
- Graph Mode Viewer/Selector
- Statistics Chart
- Statistics Summary
- Statistics Details
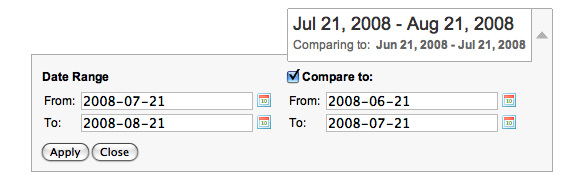
Date Range Viewer/Selector
By clicking (1), the date range selector will be shown as displayed below and you can choose the date range for the statistics data of the specific indicator. By checking the 'Compare To', you can compare with a different date range of the current indicator. But when another indicator has been chosen or another configuration has been chosen to compare with, then the compared date range will have no effect. That is, the comparing date range will only has effect when One Metric is active in the Graph Mode Selector.
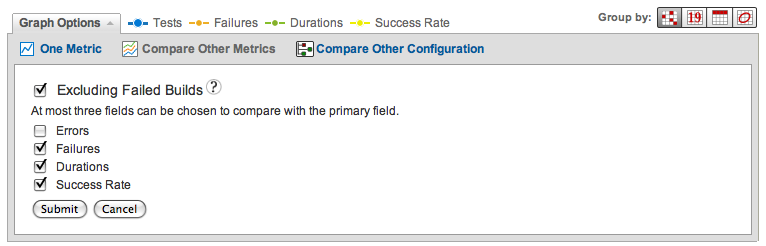
Graph Mode Viewer/Selector
By clicking (2), the comparison graph mode selector will be shown as displayed below and you can choose a different comparison mode.
The graph mode includes:
-
Group By Selector
-
Comparison Mode Selector
1. Group By Selector
The statistics can be grouped by different mode, including:
- By Version
- By Day
- By Week
- By Month
2. Comparison Mode Selector
In statistics page, several comparison modes can be chosen:
- One Metric
In this mode, you can select the different primary indicator to view its statistics data. Only in this mode, the compared data range can be used to compare the same indicator with different date range.
- Compare Two Metrics
In this mode, you can select two indicators in this report to compare.
- Compare Another Configuration
Sometimes, it is useful to compare the same report with another configuration, so you can select this mode, and you can choose a configuration by clicking the configuration tree icon or enter the path of another configuration, and then click the compare button. You can compare with the different indicator in the report of that configuration.
- Excluding Failed Builds
By checking excluding failed builds, the builds that failed will not be included in the statistics data. This may influence the statistics summary data.
Statistics Chart
This chart displays the trends of specific indicator(s) based on the graph mode and the date range you selected.
Statistics Summary
The statistics summary displays the average data for the indicator. The result is an average data of all builds in the date range, (with optionally excluding the failed builds).
Statistics Details
The detailed statistics data will be shown in this section.
- When group by version, the result is the actual data for each version.
- When group by day, the result is the average data in a day per build.
- When group by week, the result is the average data in a week per build.
- When group by month, the result is the average data in a month per build.
Customizing The Statistics
Please see how to customize the report for details.