|
QuickBuild2 Documentation
|
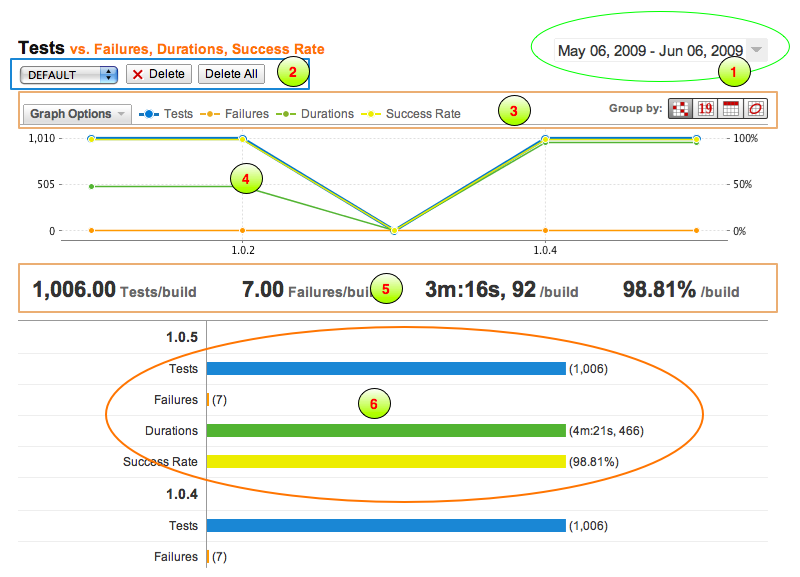
All statistics data of a configuration can be viewed in Statistics Tab. Screenshot: Statistics Tab The statistics page includes:
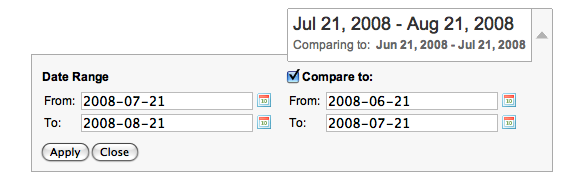
Date Range Viewer/SelectorBy clicking (1), the date range selector will be shown as displayed below and you can choose the date range for the statistics data of the specific indicator. By checking the 'Compare To', you can compare with a different date range of the current indicator. But when another indicator has been chosen or another configuration has been chosen to compare with, then the compared date range will have no effect. That is, the comparing date range will only has effect when One Metric is active in the Graph Mode Selector.
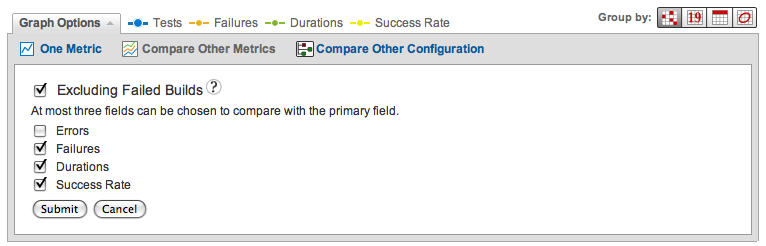
Graph Mode Viewer/SelectorBy clicking (2), the comparison graph mode selector will be shown as displayed below and you can choose a different comparison mode. The graph mode includes:
1. Group By Selector
2. Comparison Mode Selector
Statistics ChartThis chart displays the trends of specific indicator(s) based on the graph mode and the date range you selected. Statistics SummaryThe statistics summary displays the average data for the indicator. The result is an average data of all builds in the date range, (with optionally excluding the failed builds). Statistics DetailsThe detailed statistics data will be shown in this section.
Customizing The StatisticsPlease see how to customize the report for details. |
 Working with Statistics
You are viewing the current version of this page. (v. 2)