Add Custom Statistics Data
QuickBuild support add your custom statistics data and will generate the statistics chart and build overview automatically. For example, we use a test framework named rubyunit and want QuickBuild to collect the following indicators: total test count, failed test count, passed test count and total duration, then we will:
Add a custom statistics category
First, we will define the statistics data structure in QuickBuild. To define the data structure:
-
Log in to the QuickBuild server as Administrator
-
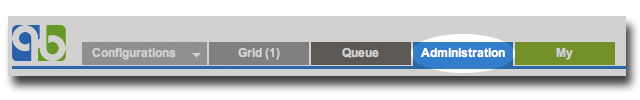
Click the 'Administration' tab in main navigation
-
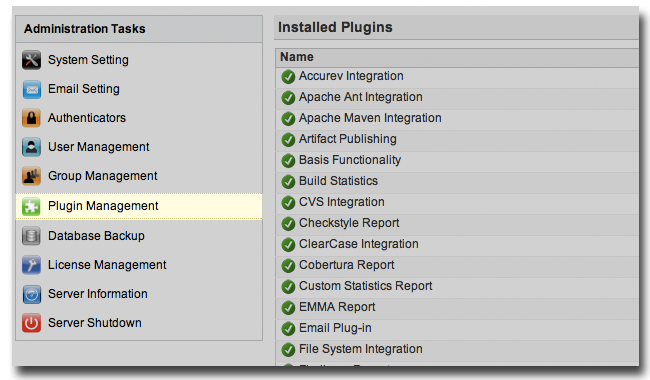
Click the 'Plugin Management' tab
-
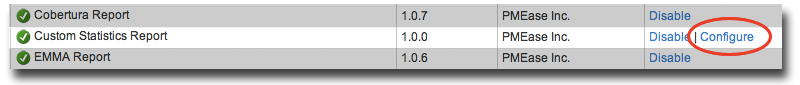
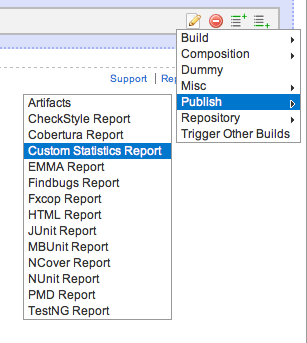
Click the 'Configure' link of 'Custom Statistics Report' plugin
-
Click 'Add New' button to add a new custom statistics category

-
Define the information of rubyunit like below
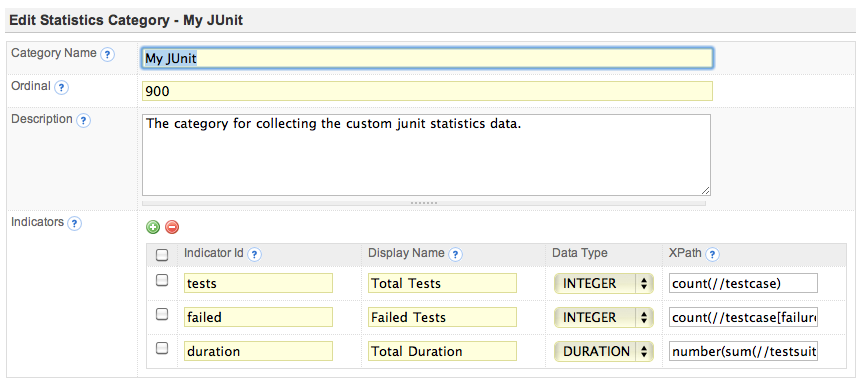
| Field Name | Description | Required |
|---|---|---|
| Category Name | The name of the category. It will be used as tab name in statistics page and also will be used as an overview section in build overview page. The category name should be unique in the whole QuickBuild. | YES |
| Ordinal | The order of the category. The QuickBuild will use this value to determine the position of this category when displayed in statistics page and build overview page. | YES |
| Description | The description of the category. | NO |
| Indicators | Indicators are what you want QuickBuild to collect from your original reports. | YES |
- Click 'Save' button.
Indicator id should be started with an alphabetic character (a-z or A-Z). For example:
Indicator123 is a good id, while 123Indicator is not.
Collect the statistics data
After defining the custom statistics category, you can now add a publish 'Custom Statistics Report' step:
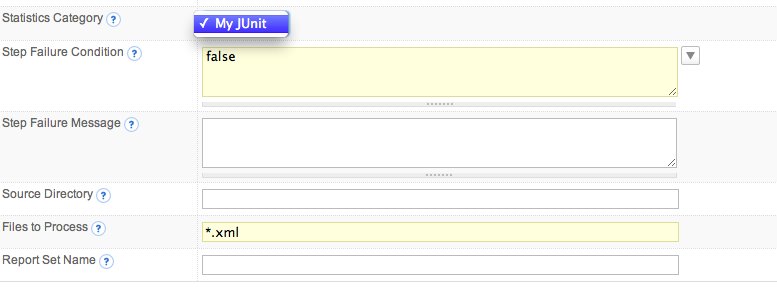
In this step, you can select a category which you defined before and then publish the XML reports where you want QuickBuild to collect the statistics data from. Just like all other publish report step, here you can specify the file patterns, step failure condition and failure message.
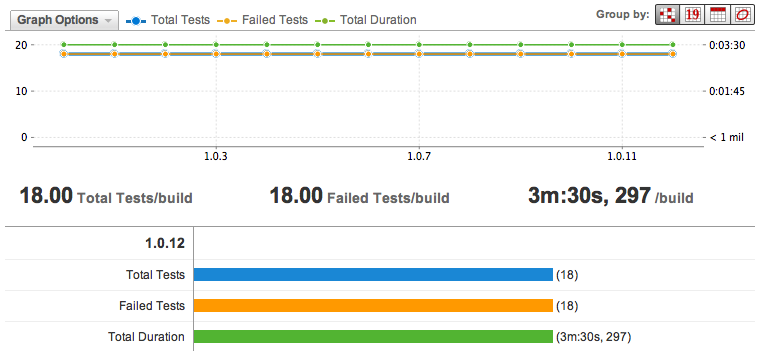
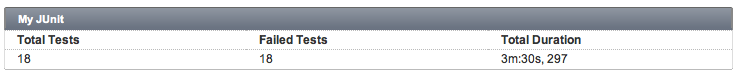
Now, you can run your configuration. After running finished, QuickBuild will show the indicators value in Build Dashboard like below:
and display the statistics chart in Statistics tab like below: